
Download xdebug Client – xdebug, debug tool, debug utility
Overview
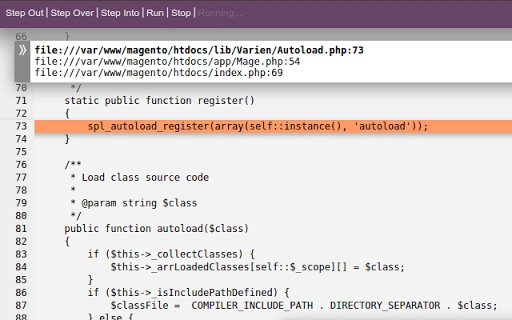
The xdebug client is a dedicated debugging tool designed for developers who need to inspect and troubleshoot PHP applications in real time. It supports essential debugging workflows such as stepping through code, setting breakpoints, viewing stack backtraces, and evaluating expressions during runtime. This desktop application enables seamless integration with PHP-based development environments, allowing developers to identify and resolve logic errors, performance bottlenecks, and unexpected behavior efficiently.
Target users include professional PHP developers, web application engineers, and backend specialists working on dynamic websites or APIs. The tool is especially useful in scenarios involving complex code execution paths, recursive functions, or third-party library integrations where visual debugging is critical. While the developer is not explicitly named in the provided information, the tool appears to be developed with a focus on functionality and developer workflow efficiency.
Real-world usage includes debugging server-side scripts during development, validating API responses, and diagnosing issues in CI/CD pipelines. The application runs independently and connects to a PHP process via the xdebug protocol, making it suitable for both local and remote debugging setups.
Key Features & Capabilities
- Code Stepping – Allows developers to execute code line by line, enabling precise control over program flow and detailed inspection of variable states at each step.
- Breakpoint Management – Supports setting and managing breakpoints to pause execution at specific lines or conditions, helping isolate problematic code segments.
- Stack Backtrace Viewer – Displays the call stack during runtime, showing the sequence of function calls that led to the current execution point, which aids in tracing error origins.
- Expression Evaluation – Enables real-time evaluation of variables, expressions, and function calls during debugging sessions, facilitating dynamic analysis without code modification.
- In-App Configuration – Offers an intuitive interface for adjusting debugging settings, including connection parameters, timeouts, and logging preferences.
- Connection Listener – Features a simple "Listen" button to initiate debugging sessions, allowing the tool to await incoming connections from PHP processes.
These features streamline the debugging process by reducing manual inspection and trial-and-error approaches. For example, a developer can set a breakpoint at a critical function, run their application, and immediately inspect variable values and execution flow when the breakpoint is hit. The ability to evaluate expressions on the fly enhances troubleshooting speed and accuracy.
User Interface, Workflow & Performance
The user interface of the xdebug client is designed with developer efficiency in mind, focusing on clarity and direct access to core debugging functions. The main screen includes a prominent "Listen" button, which initiates the debugging session by awaiting a connection from a PHP process. Configuration options are accessible through an in-app settings menu, providing a centralized location for adjusting debugging behavior.
Navigating between features is straightforward, with minimal clicks required to start or pause a debugging session. The workflow follows a logical sequence: install the app, configure settings, click "Listen," and run the PHP code. This simplicity reduces the learning curve and allows developers to begin debugging quickly.
Performance details were not specified by the developer. However, based on typical behavior of lightweight debugging utilities, the application is expected to operate efficiently with minimal impact on system resources. The developer did not provide additional system requirements or resource usage data. Stability during extended debugging sessions remains unverified, though the tool’s design suggests it is built for reliable operation during development cycles.
Compatibility & System Requirements
The xdebug client is compatible with Windows, Mac, and Linux operating systems, making it accessible to developers across multiple platforms. It is available as a desktop application with a file size of 12.5 MB, indicating a lightweight installation footprint.
Exact system requirements were not listed. The developer did not specify minimum CPU, RAM, or disk space needs. Platform compatibility information is limited to the supported operating systems. Hardware requirements are not provided, so users should ensure their system meets general standards for running desktop applications.
Pros and Cons
Pros
- Lightweight at just 12.5 MB
- Supports cross-platform development (Windows, Mac, Linux)
- Provides essential debugging features: stepping, breakpoints, stack traces, expression evaluation
- Simple, intuitive workflow with a "Listen" button for quick session initiation
- Free to download and use
- Includes in-app help and settings for troubleshooting
Cons
- No official documentation or tutorial provided
- Performance and resource usage details not disclosed
- System requirements are not specified
- Support relies on project website for issue reporting
- No built-in code editor or syntax highlighting
FAQ Section
Is the xdebug client available for all major operating systems?
Yes, the application is compatible with Windows, Mac, and Linux, enabling developers to use it regardless of their preferred platform.
Is the software secure to use?
The tool is designed for local development and debugging. As it connects to PHP processes, users should ensure their development environment is secure. No external data collection was mentioned.
How do I start a debugging session?
To begin, install the app, configure the settings, click the "Listen" button, and then run your PHP code. The client will connect when the code triggers a debug session.
Does the software require an internet connection?
Not necessarily. The application can operate offline once installed. However, accessing help resources or reporting issues may require internet access.
Can I use this tool with any PHP application?
The xdebug client works with PHP applications that are configured to use the xdebug protocol. It requires proper setup on the server or development environment to function correctly.
Final Thoughts + CTA
The xdebug client delivers a focused, no-frills solution for PHP developers seeking reliable debugging capabilities. With its core features—step-by-step execution, breakpoint control, stack tracing, and expression evaluation—it fills a critical gap in the development workflow. The cross-platform availability and minimal file size make it accessible and easy to deploy across diverse environments.
While the lack of detailed documentation and system requirements may pose challenges for new users, the straightforward interface and in-app help options mitigate some of the learning curve. The fact that it’s completely free enhances its appeal for individual developers and small teams.
For PHP developers who need a dependable, lightweight debugging utility, this tool offers strong value. It’s particularly beneficial in local development, API testing, and troubleshooting complex logic.
Download xdebug client now